This project is an attempt to make it easier to discover a codebase.
There is always a lot to learn when working with an unfamiliar codebase, and it can take time to get a sense of how the different parts relate to each other.
Our IDEs can help us navigating in the code by jumping from one reference to a definition and other niceties. However exploring the files one by one can make it difficult to build a mental model.
Collecting data
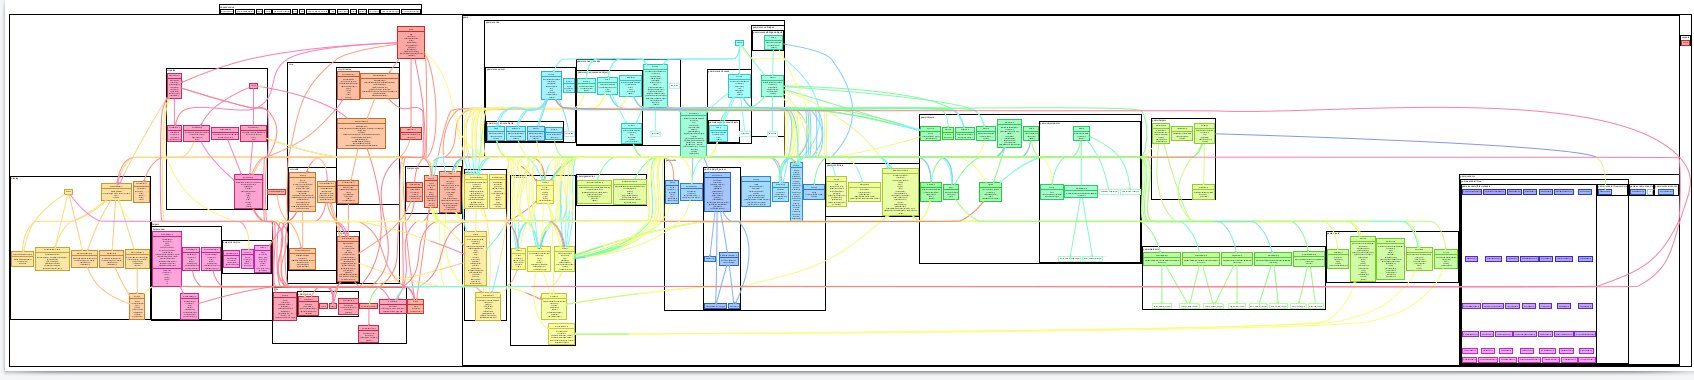
This tool traverses the directory of a project, collecting the sub-directories structures and the files.
When identifying a js file, it uses esprima to parse the content.
The import statements are used to create the connections between the blocks, the classes and methods signatures are used to build a summary of the file's content.
Layout
The layout is delegated to graphviz. It is a fantastic open source graph visualization software.
Graphviz has its own language, called Dot, for describing graphs. To get graphviz to produce a result from node, the graph must be described as a text string. Building this string can be tedious for advanced graphs, so I made a tiny utility called graphviz-doc-builder to make the task manageable.
Colors
Each file is attributed a hue in the [0, 360] range. The graph is traversed in a "depth-first" order, so files that are close in the structure have similar colors.